Why Your Dashboard Can Say "Healthy" While Your Users Can't Use the Product
CPU normal, memory normal, error rate 0.2% — and support says users can't check out. Why infrastructure health and user experience are measured by different questions.
- Architecture Breakdown
- Observability
- Distributed Systems
- Software Architecture
- System Design
Your dashboard is green. CPU: 42%. Memory: 58%. Error rate: 0.2%. All services: healthy.
Then someone from support says: "Users are saying the application is extremely slow."
So who's wrong? Usually, neither. Your infrastructure can be perfectly healthy while your users are having a terrible experience — one of the biggest lessons in production engineering.
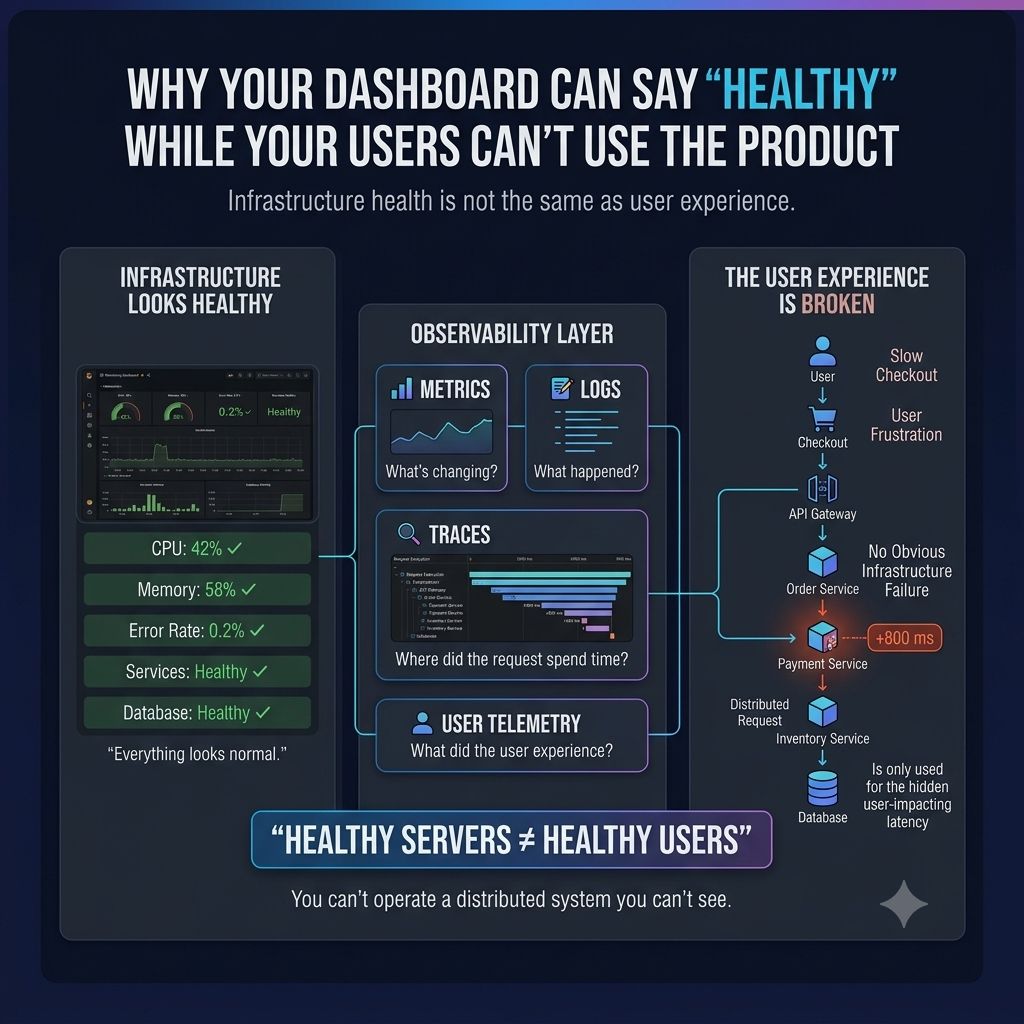
Imagine this request: user clicks "Checkout" → Frontend → API Gateway → Order Service → Payment Service → Inventory Service → Database.
Every component can look individually healthy. But if one dependency adds 800ms to the request, the user feels the entire 800ms. And if that only happens for 5% of requests, users in one region, one API endpoint, or one browser version, your average metrics might barely move.
That's where traditional monitoring starts falling short. You don't just need to know "is the server healthy?" You need to answer: "What happened to this user's request?"
That's the difference between monitoring and observability. Monitoring tells you something is wrong. Observability helps you investigate where it went wrong, for whom, and why.
A production-grade observability strategy connects:
- 📊 Metrics — what's changing?
- 📝 Logs — what happened?
- 🔍 Traces — where did the request spend its time?
- 👤 User telemetry — what did the user actually experience?
And this changes how teams debug production. Instead of "the API looks fine," you can ask: "show me the slow requests from users experiencing checkout latency." That's a completely different level of visibility.
One architectural lesson I keep coming back to: You can't operate a distributed system you can't see. The more services you add, the more important observability becomes — because complexity doesn't just make systems harder to build, it makes failures harder to explain.
What production signal has saved you the most during a difficult incident — metrics, logs, traces, or user telemetry?
Keep reading
Why Great Systems Don't Make You Wait for Everything
Order confirmation shouldn't wait on payment, inventory, email, and analytics to all finish. How separating the critical path from everything else keeps event-driven systems responsive.
How Does Netflix Know Something Is Broken Before You Do?
Thousands of services sit behind a single "Press Play" — how Netflix connects metrics, logs, traces, and client telemetry to catch playback failures before users report them.
Why Does One Slow Service Make Your Whole App Feel Slow?
An API that "responds in 1.8 seconds" is rarely slow on its own — distributed tracing breaks a request into spans to show which dependency actually spent the time.