Why Does One Slow Service Make Your Whole App Feel Slow?
An API that "responds in 1.8 seconds" is rarely slow on its own — distributed tracing breaks a request into spans to show which dependency actually spent the time.
- System Design Explained
- Distributed Tracing
- Observability
- Distributed Systems
- System Design
Your API responds in 1.8 seconds. The obvious question is: "Why is the API slow?"
But that's not really the problem. The API might only be spending 100ms doing its own work. The remaining 1.7 seconds could be hiding somewhere else — maybe Authentication: 50ms, User Service: 120ms, Product Service: 180ms, Payment Service: 900ms, Database: 350ms, Network overhead: 100ms.
Now you have a completely different problem. The API isn't necessarily slow — something inside the request is slow. That's exactly why distributed tracing exists.
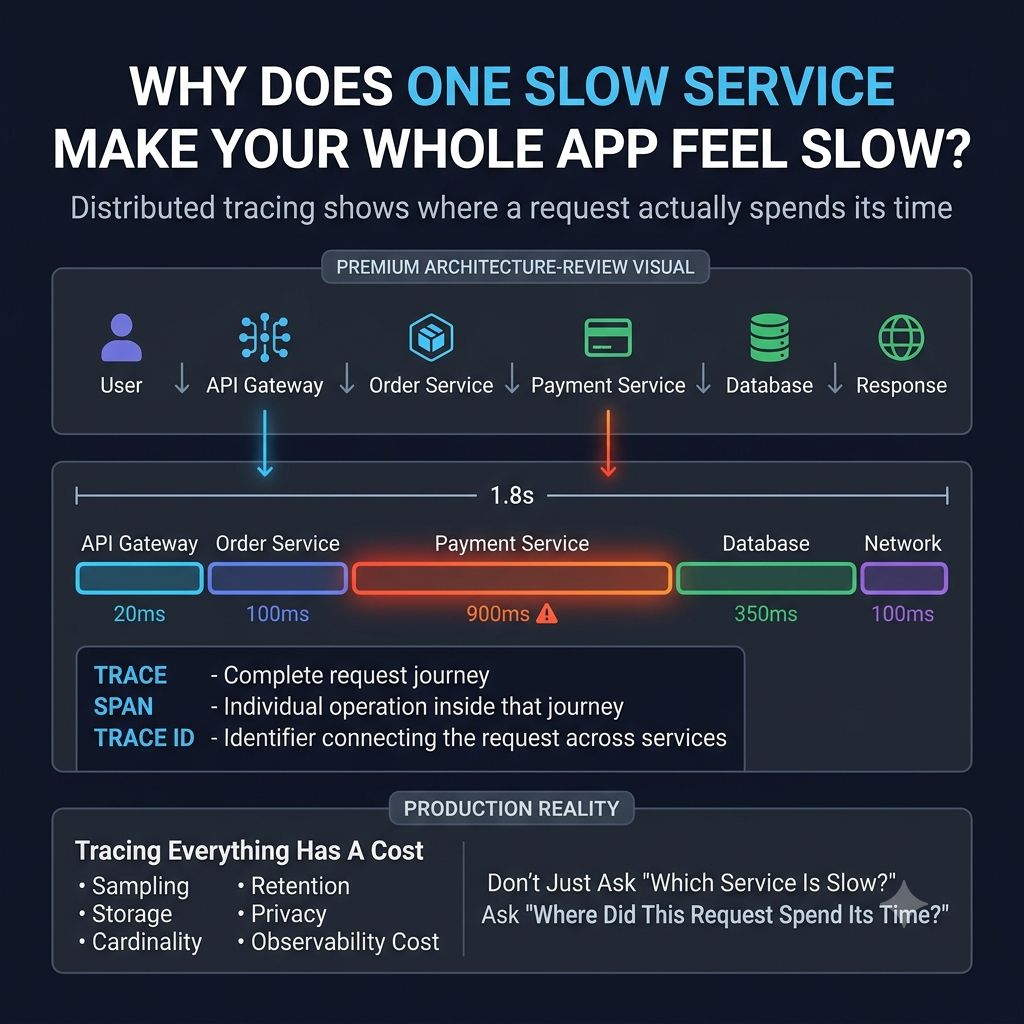
Instead of seeing "Request → 1.8 seconds," you can see the request broken into spans — API Gateway (20ms), Order Service (100ms), Payment Service (900ms ⚠️), Database (350ms) — and the complete journey becomes a trace.
Suddenly you can answer questions logs and basic metrics struggle with: which service added the latency? Which dependency failed? Where did this particular request spend its time?
This becomes critical as architectures become more distributed. One user action might cross the frontend, a CDN, an API gateway, authentication, multiple microservices, a cache, a database, and external APIs. If each service only tells you "I'm healthy," you still don't know why the user's request is slow.
But there's another production reality: tracing everything isn't free. At high traffic volumes, teams have to think about sampling, trace storage, cardinality, PII, retention, and cost.
So the goal isn't "collect every trace forever." The goal is: Capture enough context to explain the failures that matter.
One lesson I keep coming back to: When systems become distributed, debugging must become distributed too. You don't just need to know which service is unhealthy — you need to know what happened to the request.
What has been the hardest production latency problem you've had to trace across multiple services?
Keep reading
How Does Netflix Know Something Is Broken Before You Do?
Thousands of services sit behind a single "Press Play" — how Netflix connects metrics, logs, traces, and client telemetry to catch playback failures before users report them.
Why Your Dashboard Can Say "Healthy" While Your Users Can't Use the Product
CPU normal, memory normal, error rate 0.2% — and support says users can't check out. Why infrastructure health and user experience are measured by different questions.
Why Doesn't Your Order Confirmation Wait for Everything to Finish?
Payment, inventory, fraud checks, shipping, notifications — a single "Order Confirmed" doesn't wait for all of them. How publish-subscribe events let one action fan out into independent workflows.