The Hardest Production Bug Is the One Your Telemetry Can't Explain
No error spike, no CPU alert, no obvious exception — just users saying something's wrong. Why the hardest incidents get solved by slicing the data, not staring at the average.
- Production Lessons
- Observability
- Site Reliability
- Incident Management
- Distributed Systems
Some production incidents are easy to diagnose — error rate spikes, CPU hits 100%, a database goes down. The logs practically tell you what happened.
The difficult incidents look completely different: everything is green, no obvious error spike, no infrastructure alert, no clear exception. But users are saying: "Something is wrong."
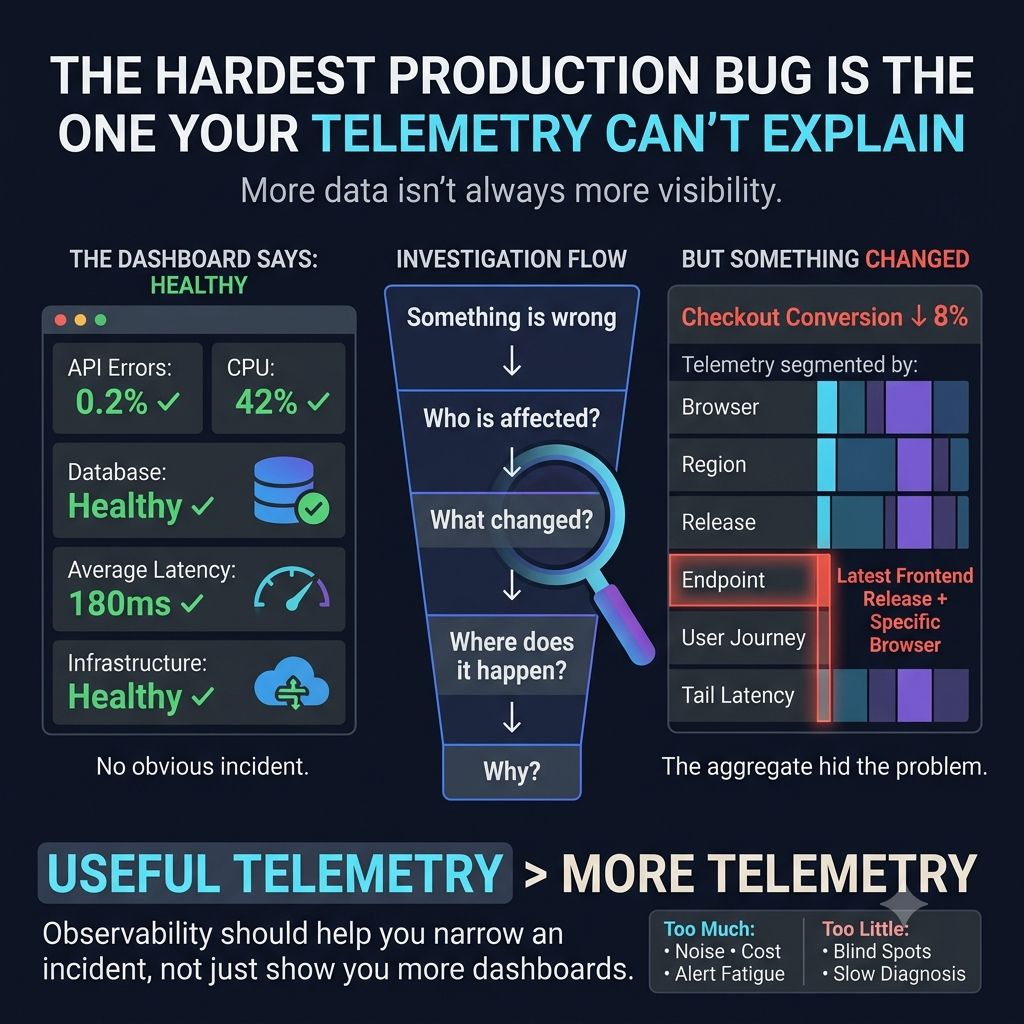
That's when observability becomes much more than collecting logs. Imagine this: your checkout conversion drops by 8%, but API errors, CPU, database, and latency average all look normal, and the last deployment shows no obvious issue. So where do you start?
This is where experienced teams stop asking "what service is broken?" and start asking "what changed?"
Look at specific browser versions, specific regions, specific releases, specific API endpoints, specific user journeys, tail latency, error distribution, dependency behavior, and business metrics. Suddenly you might discover only users on one browser version are affected, or only users who received the latest frontend bundle, or only requests crossing one dependency, or only the slowest 1% of requests are failing.
The average hid the problem. The aggregate hid the problem. The infrastructure dashboard hid the problem. The slice of data revealed it.
That's one of the most important production lessons I've learned: Observability isn't about having more dashboards. It's about being able to ask better questions of your system.
Good telemetry should let you move from "something is wrong" to "who is affected?" to "what changed?" to "where does it happen?" to "why is it happening?"
There's an important trade-off too. Instrument everything and you create noise, storage costs, privacy concerns, and alert fatigue. Instrument too little, and your next incident becomes archaeology. The goal isn't maximum telemetry — it's useful telemetry.
One principle I strongly believe in: If your observability system can't help you narrow an incident, you're collecting data, not creating visibility.
What production signal has helped you find a problem that the standard dashboards completely missed?
Keep reading
How Does Netflix Know Something Is Broken Before You Do?
Thousands of services sit behind a single "Press Play" — how Netflix connects metrics, logs, traces, and client telemetry to catch playback failures before users report them.
Why the Biggest Production Mistake Is Trying to Say Yes to Every Request
Trying to process every request immediately is often what takes a system down, not the traffic itself. Why resilient systems reject, throttle, and shed load instead of pretending capacity is infinite.
Why Does One Slow Service Make Your Whole App Feel Slow?
An API that "responds in 1.8 seconds" is rarely slow on its own — distributed tracing breaks a request into spans to show which dependency actually spent the time.